
The right starting set of community health outcomes metrics has three parts: output measures (screenings, referrals, services delivered), short- and medium-term outcome indicators tied to your logic model, and closed-loop referral completion rates. Together, these show whether a program is reaching the people who need it, whether referrals actually result in help, and whether disparities may be narrowing. Tracking all three gives program directors what funders now expect: proof of follow-through, not just activity.
TL;DR:
- Tracking only activity volume measures like screenings or referrals is insufficient; programs must also monitor referral completion rates and long-term health outcomes.
- Selecting metrics requires mapping them to a clear logic model and considering relevance, data availability, comparability, and community validation, with 2 to 4 headline outcomes.
- Disaggregating data by race, ethnicity, income, and geography down to census tracts reveals disparities hidden in county-level averages, guiding equity-focused interventions.
- Closed-loop referral tracking, capturing each stage from referral issued to service delivered and closed, significantly improves understanding of actual help provided.
- Building a funder-ready dashboard involves trend analysis, disparity charts, and clear documentation of methods, with pilot testing and a small set of key metrics.
Table of Contents
- What Are the Core Metric Categories in Community Health?
- How Do You Choose Which Metrics to Track?
- Why Disaggregated Data Matters for Health Equity
- How Long Does It Take to See Change in Health Outcomes?
- How Does Closed-Loop Referral Tracking Fit Into Outcome Measurement?
- What Should a Funder-Ready Dashboard Include?
- 9 Steps to Start Measuring Outcomes This Quarter
- How EquiLoop and WellCheck Resources Support Measurement
- Sources
- FAQ
What Are the Core Metric Categories in Community Health?
Community health measurement breaks down into two broad families, and confusing them is one of the most common reporting mistakes. NACCHO’s performance management guidance draws a clear line between output performance measures, which count activity volume, and outcome performance measures, which track long-term impact. A program can hit every output target and still fail the people it serves if no one measures what happened after the activity.
Here is how that breakdown looks in practice:
- Outputs: screenings completed (numerator: screenings done, denominator: eligible population), referrals made, services delivered.
- Short-term outcomes: referral acceptance rate, referral completion/closure rate, days from referral to first service.
- Medium- and long-term outcomes: emergency department visits for ambulatory-care-sensitive conditions, hospital admissions, disease-specific indicators like controlled blood pressure or A1c levels.
- SDOH domain indicators: food insecurity prevalence, housing stability rates, transportation or transit access measures.
Express each metric the way it will actually be used. A rate per 1,000 residents works for population-level comparisons across census tracts; a simple percentage works better for referral completion within a single program; absolute counts matter most to funders asking “how many people.” The denominator you choose changes the story the number tells, so pick it deliberately and keep it consistent across reporting periods.
How Do You Choose Which Metrics to Track?
Start with a one-page logic model. Map activities to outputs, then to short-term outcomes, then to medium- and long-term outcomes. Every metric you pick should trace back to a box on that page. Programs that skip this step end up tracking whatever is easy to pull from a spreadsheet instead of what actually proves impact.
From there, apply four criteria to narrow the list:
- Relevance to your theory of change, not just availability.
- Data availability and the staff burden of collecting it.
- Comparability with partner organizations and regional benchmarks.
- Community relevance, validated by the people the program serves.
Bring multisector partners and community members into that validation step early. The Build Healthy Places Network’s community-driven data toolkit points to participatory scorecards and asset mapping as ways to keep measures grounded in what residents actually experience, not just what a grant application requires. Aim for 2 to 4 headline outcome measures, backed by a handful of process metrics that explain movement in the headline numbers.
Pro Tip: Write down why you rejected the metrics you didn’t pick. Funders and new partners will ask, and “we considered X but data collection burden was too high for our current staffing” is a far stronger answer than silence.
Why Disaggregated Data Matters for Health Equity
A county-level average can hide a neighborhood-level crisis. Disaggregating by race and ethnicity, age, census tract, language, and income is what turns a flat number into a tool for finding inequities. The CDC’s program evaluation framework recommends pushing disaggregation down to the smallest reliable geography, census tract where possible, rather than settling for county-level rollups that flatten disparities.
You rarely have to build this from scratch. Pair your program data with existing public sources:
- American Community Survey (ACS) for demographic and housing detail.
- Behavioral Risk Factor Surveillance System (BRFSS) for health behavior trends.
- County Health Rankings for cross-county comparisons.
- CDC/ATSDR Social Vulnerability Index (SVI) for community-level risk scoring.
One study found the Community Deprivation Index correlated more strongly with emergency department visits compared with the Area Deprivation Index, according to research published in the Journal of Accountable Care Organizations. That gap matters when you are choosing which deprivation index to layer under your outcome data in an urban service area.
Set data governance and consent expectations before you collect a single record: who can see disaggregated data, how it’s stored, and how individual screening results connect to community-level indicators without exposing anyone. When a stratum gets too small to report reliably, say so in the footnote rather than suppressing the row entirely.

How Long Does It Take to See Change in Health Outcomes?
Setting a target without a timeline sets programs up to look like they’re failing when they’re actually on schedule. Match your expectations to the type of metric:
- Short-term (weeks to months): referral acceptance, screening volume, days-to-first-service. Track these monthly and expect movement within a quarter.
- Medium-term (1 to 2 years): referral completion rates trending upward, reduced no-show rates, early shifts in chronic disease control. Use percent-change reporting here.
- Long-term (multiple years): ED visits for ambulatory-care-sensitive conditions, hospital admission rates, population-level disease prevalence. These need multi-year monitoring and often require comparison groups or interrupted time series to attribute change to the program rather than outside factors.
Phased or pilot reporting is a legitimate strategy in year one. Full baselines can wait until infrastructure is stable enough to trust the numbers. Long-term, population-level change usually requires cross-sector action beyond any single program, so build that caveat into every report before a board or funder mistakes a flat long-term line for program failure.
How Does Closed-Loop Referral Tracking Fit Into Outcome Measurement?
An output like “referrals made” tells you almost nothing on its own. What converts that output into a real outcome is knowing what happened after the referral left your hands. Closed-loop referral tracking follows five stages: referral issued, partner acceptance, appointment scheduled, service delivered, referral closed.
The operational metrics worth watching at each stage are specific: time to acceptance, time from referral to first service, completion or closure rate, and a categorized reason code whenever a referral goes unresolved or is refused. Without that last category, “unresolved” becomes a black box that hides whether the problem was transportation, eligibility, or a partner simply not responding.
- Time from referral issued to partner acceptance.
- Time from acceptance to service delivery.
- Percentage of referrals closed with a documented outcome.
- Reason codes for every unresolved or declined referral.
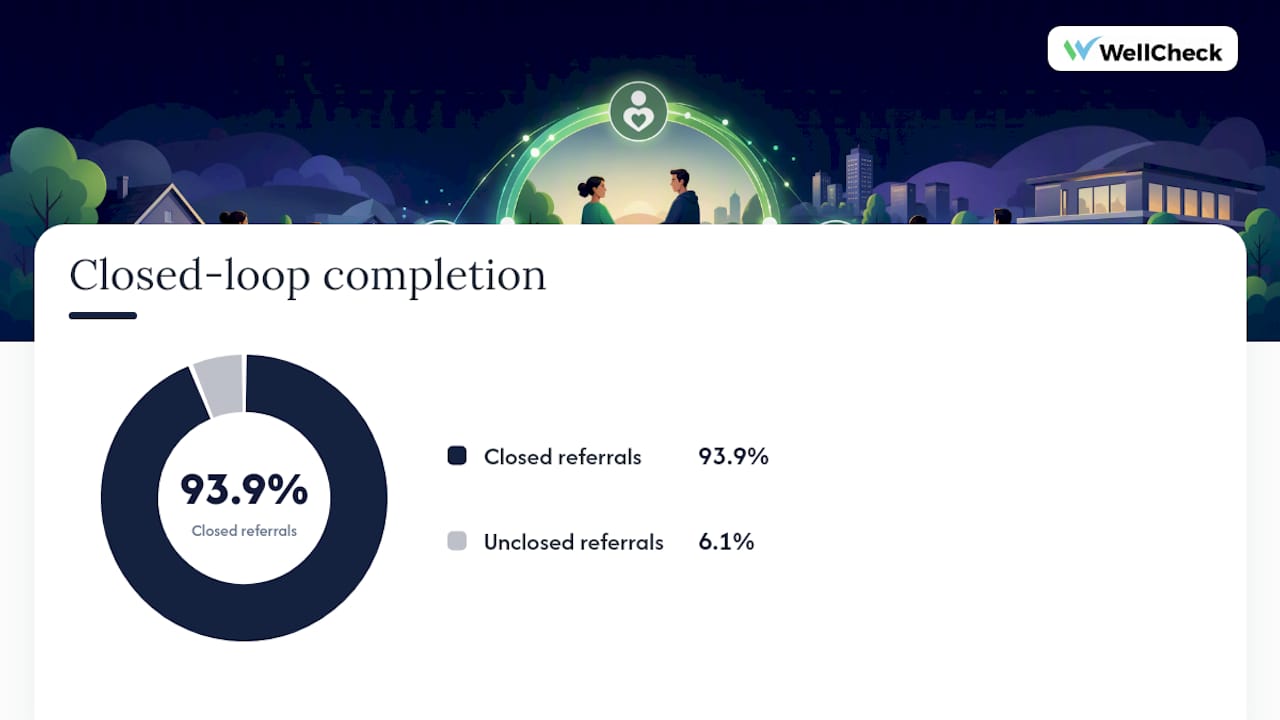
An interoperable, configurable platform can carry this workload without replacing the systems a clinic already trusts for its medical record. In one rural health hub deployment with a multi-partner ecosystem, closed-loop tracking covered 22,682 individuals screened and 45,458 services delivered, with a 93.9% closed-loop completion rate.* That kind of completion rate depends on clear partner agreements, documented data-sharing permissions, and an escalation path for referrals that stall.
Pro Tip: If your closure rate looks suspiciously high, check whether “closed” means “resolved” or just “no longer being tracked.” Those are very different numbers wearing the same label.
*Rural health hub deployment with a multi-partner ecosystem.
Includes both clinical and social services referrals.
What Should a Funder-Ready Dashboard Include?
A dashboard that tries to show everything shows nothing clearly. Pick a small set of headline metrics, then let disaggregated drilldowns live beneath them for the reader who wants detail.
- Trend lines for your 2 to 4 headline outcome measures over time.
- Disparity-gap charts comparing outcomes across demographic groups.
- Choropleth maps showing outcomes by census tract where geography matters.
- A simple summary table formatted for funder extracts, no scrolling required.
Every chart needs a methods note nearby: definitions, timeframes, denominators, and how complete the underlying data actually is. A short narrative box tying a metric’s movement to a specific intervention (a new partner clinic, an added outreach shift) turns a chart into a story a program officer can repeat to their own board. Close every report with a brief appendix listing known data limitations and what you plan to fix next quarter. Funders trust programs that name their own gaps.
9 Steps to Start Measuring Outcomes This Quarter
- Draft a one-page logic model connecting activities to outcomes.
- Choose 2 to 4 priority metrics based on that model.
- Map every data source and assign a data steward to each one.
- Agree on disaggregation fields with partners before collecting data.
- Draft data-sharing agreements covering consent and access.
- Set a baseline period, no shorter than one full reporting cycle.
- Set realistic short-term targets tied to that baseline.
- Pilot closed-loop tracking with one or two partners and log time-to-closure.
- Prepare a one-page funder-ready report and revise based on what the pilot reveals.
Pro Tip: Run the pilot with your most reliable partner first, not your biggest one. A clean 90-day dataset from a smaller partner beats a messy one from your largest referral source.
How EquiLoop and WellCheck Resources Support Measurement
Most of the steps above depend on infrastructure a spreadsheet cannot provide, especially the closed-loop tracking piece. EquiLoop handles SDoH screening, referral routing to clinical and community partners, follow-up and status tracking, outcomes dashboards, and funder-ready reporting exports, built around the partner network and reporting requirements your organization already has.
If your measurement gap is on the staffing side, the Workforce Development Academy is a white-labeled training and credentialing platform for community health workers, navigators, and the broader health workforce, useful for programs that need staff trained on data collection protocols before a new metric set can be trusted.
For program directors weighing whether a platform like this fits their referral volume, the closed-loop referral implementation guide walks through what a rollout actually involves. WellCheck offers a 30-minute demo at Calendly for teams that want to see how referral tracking and outcome dashboards work before committing to a build.
Sources
- CDC program evaluation framework (MMWR, 2024)
- NACCHO Performance Management System Guide (2024)
- Journal of Accountable Care Organizations (2024) – Community Deprivation Index study
FAQ
What Is the Difference Between an Output and an Outcome Metric?
An output measures activity volume, like the number of screenings completed, while an outcome measures the result of that activity, like whether a referral was completed or an ED visit was avoided.
Which SDOH Domains Should a Program Measure First?
Food insecurity, housing stability, and transportation access are the domains most programs prioritize first because they have available screening tools and clear links to short-term outcome indicators.
How Many Metrics Should a Community Health Program Track?
Most programs do best with 2 to 4 headline outcome measures supported by a small set of process metrics, since a longer list becomes too costly to maintain and too hard for funders to follow.
What Is a Closed-Loop Referral Completion Rate?
It is the percentage of referrals that reach a documented outcome, accepted, scheduled, delivered, and closed, rather than simply being sent and never confirmed; platforms like EquiLoop are built specifically to track this stage by stage.
How Often Should Community Health Data Be Disaggregated?
Disaggregate by race, ethnicity, census tract, and income at every reporting cycle where sample size allows, since county-level averages routinely mask neighborhood-level disparities that matter most for equity-focused programs.

