
The most useful care coordination KPIs measure what happened after a referral was made: whether it was accepted, whether the person was seen, and whether the need was resolved. Service volume tells a funder how busy a program is. Follow-through tells them whether the program works. This guide covers the KPIs worth tracking at a rural or community health program, how to define each one, and how to collect the data without adding hours to your team’s week.
TL;DR
- Track follow-through, not only activity. Referral completion, time to close, and need resolution matter more than referral counts.
- Define every KPI with a numerator, a denominator, and a time window before you collect data, so the numbers hold up with funders and payers.
- Referral engagement is often low. One CDC-published pilot reported 29% engagement, so measure it honestly.
- Informal information exchange is the main barrier to tracking. Structured fields and a closed-loop workflow fix the data problem at its source.
- Start with five to seven KPIs. A short list that gets reviewed monthly beats a long list nobody opens.
Table of Contents
- Why volume metrics are not enough
- The framework to organize your KPIs
- Core KPIs for care coordination
- Clinical and population KPIs your funders may already require
- Capacity and workforce KPIs
- How to set up KPI tracking in practice
- Manual tracking versus a closed-loop platform
- Where EquiLoop fits
- Common mistakes to avoid
- FAQ
- Sources
Why volume metrics are not enough
Most programs can report how many screenings they ran, how many referrals they sent, and how many clients they served. Those are activity counts. They do not answer the questions funders and payers now ask: Did the client reach the service? Did the service meet the need? How long did it take?
Implementation research in the CDC’s journal Preventing Chronic Disease points to reliance on informal, ad hoc information exchange as a core barrier to coordinated care. Data on social risk is often split across verbal conversations, paper surveys, and inconsistent EHR notes. When the information lives in three places, no one can say what share of referrals closed.
Payment models are moving the same direction. CMS describes the Transforming Episode Accountability Model (TEAM) as a model that ties hospital payment to quality performance, including care coordination and transitions. Hospital-based programs feel this first, but community partners that receive their referrals will be asked for data as well.
The framework to organize your KPIs
Before choosing metrics, it helps to sort them. AHRQ’s Care Coordination Measures Atlas catalogues 61 measures and maps them to a measurement framework. You do not need 61. You do need to know which part of the process each KPI covers. A practical grouping for a community health program:
- Reach: who was screened and who screened positive for a need.
- Handoff: whether referrals were sent, received, and accepted.
- Follow-through: whether the client was seen and the service delivered.
- Resolution: whether the need was met, and how fast.
- Capacity: whether staff and partners can keep up with demand.
AHRQ’s measurement framework chapter is a good reference if you want to see how researchers define the domains behind these groups.
Core KPIs for care coordination
The table below lists the KPIs we see as the working set for rural and community programs. Each has a plain definition you can put in a data dictionary.
| KPI | Numerator | Denominator | Why it matters |
|---|---|---|---|
| Screening rate | Clients screened for social needs | Eligible clients seen in the period | Shows reach of the front door |
| Positive screen rate | Clients with at least one identified need | Clients screened | Sizes demand by need type |
| Referral rate | Positive screens with a referral made | Clients with an identified need | Catches needs that never get a referral |
| Referral acceptance rate | Referrals accepted by the receiving partner | Referrals sent | Shows partner capacity and routing quality |
| Referral completion rate | Referrals where the service was delivered | Referrals sent | The central follow-through measure |
| Time to close | Days from referral to documented outcome | Closed referrals | Shows delays by partner and need type |
| Need resolution rate | Needs documented as resolved | Needs identified | Connects activity to outcomes |
| Loss to follow-up | Referrals with no known status after the set window | Referrals sent | Flags where the loop is open |
Referral completion rate
This is the KPI to put at the top of the dashboard. A referral counts as complete only when the receiving organization confirms the client was served. “Sent” is not complete. “Appointment scheduled” is not complete.
The reference point many clinics already know is CMS Quality ID #374, Closing the Referral Loop: Receipt of Specialist Report. It measures the percentage of referred patients for whom the referring provider receives a report back from the provider they were sent to. It is documented with G-codes: G9969 for met and G9970 for not met. Measure 374 covers clinical specialist referrals. Community and social service referrals need the same discipline, with a confirmation from the community partner standing in for the specialist report.
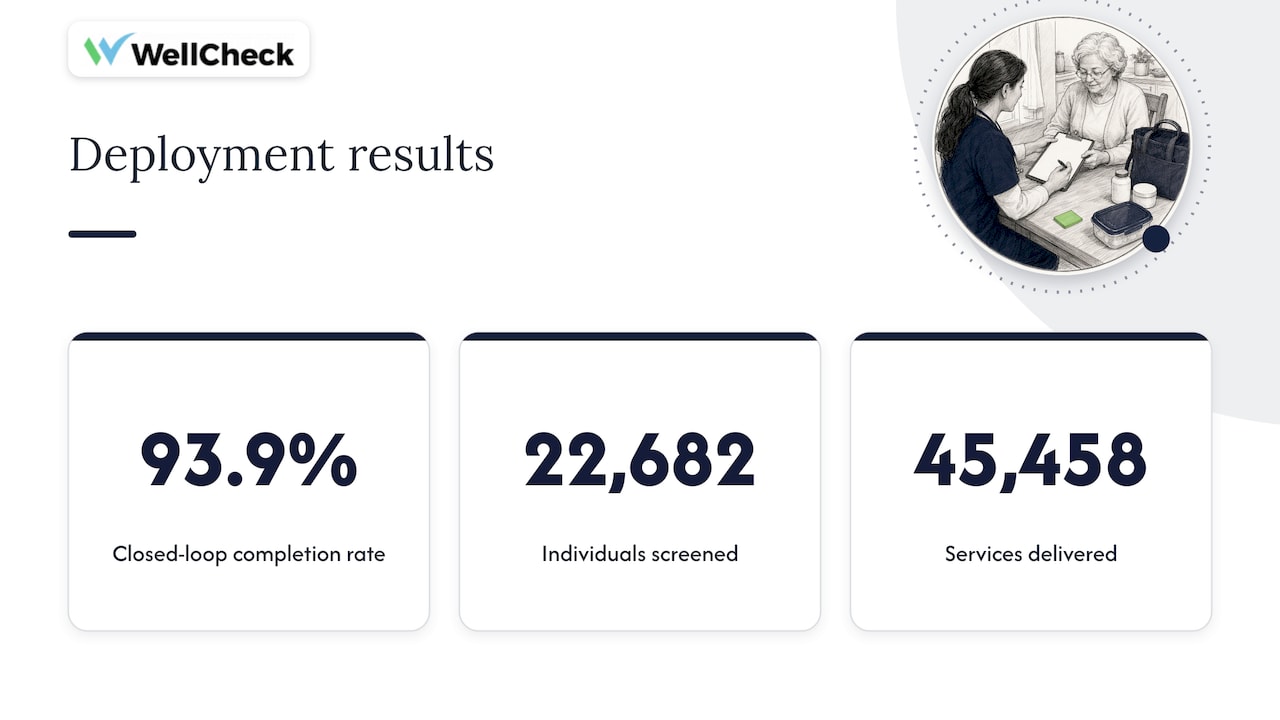
For context on what we report ourselves: WellCheck-supported initiatives have shown a 93.9% closed-loop completion rate across 22,682 individuals screened and 45,458 services delivered. Those figures come from one deployment and describe that deployment only.
Rural health hub deployment with a multi-partner ecosystem. Includes both clinical and social services referrals.
Referral engagement rate
Completion tells you what share of referrals closed with a service. Engagement tells you how many referred people actually took part in a program. They are close cousins and worth tracking separately when the service is a multi-week program rather than a single visit.
A CDC-published evaluation of referrals from health care organizations to community-based programs found 1,063 of 3,660 referred individuals participated, an engagement rate of 29%. The authors tied engagement to awareness, provider credibility, and fewer barriers such as cost and transportation. Your own rate will differ. The point is that a low number is common at the start, and you cannot improve what you do not measure.
AHRQ’s fact sheet on referral tracking adds a useful observation: families often do not understand where they are being referred or why, and practices that tracked referrals concluded that engagement was a better measure of success than referral volume.
Time to close
Measure the median and the 90th percentile in days, by referral type and by receiving partner. The median shows normal performance. The 90th percentile shows how long your slowest cases wait. A housing referral and a food referral should not share a target.
Set a status window for each pathway. For example, a program might decide that any referral with no confirmed status after a set number of days is flagged for outreach. The number should be your own, based on what each partner can realistically do. That flag feeds the loss-to-follow-up KPI.
Need resolution rate
Resolution is the hardest KPI to capture and the one funders value most. A completed referral means a service was delivered. A resolved need means the client’s situation changed: the person has transportation, the utility shutoff was avoided, the client is enrolled in coverage.
Define “resolved” per need category in advance. Allow three outcomes: resolved, partially resolved, and not resolved, with a reason code for the last. Reason codes (client declined, partner at capacity, client unreachable, ineligible) turn a failure into a fixable operational problem.
Loss to follow-up
This is the inverse of completion, split into causes. Report it by partner and by need type. If one partner accounts for most of the unknown statuses, you have a routing or communication issue, not a client issue.
Clinical and population KPIs your funders may already require
Social needs KPIs sit next to clinical ones. Federally qualified health centers report standardized measures through the Uniform Data System. HRSA’s data shows that in 2023, 72% of patients over 12 were screened for depression with a follow-up plan where appropriate, up 7 percentage points from 2020, with hypertension control at 66% and breast cancer screening at 52%. HRSA’s 2023 UDS trends brief gives the wider picture of how health centers report.
You do not need to own these measures to benefit from them. If your care coordination program supports patients with hypertension or behavioral health needs, linking referral completion to the clinical measure your health center partner already reports is a strong way to show impact. Ask the partner which measures they are accountable for, then build a view that shows referrals in that population.
Capacity and workforce KPIs
Systems fail when people are stretched. The CDC-published qualitative research cited above notes that programs relying on staff with competing clinical duties struggle with accountability, and successful ones often invest in dedicated roles such as community health workers or navigators who own the referral pathway.
Useful capacity KPIs:
- Active referrals per navigator or CHW: the caseload that is open and unresolved.
- Overdue follow-ups per staff member: referrals past their status window.
- Partner response time: hours or days from referral sent to accepted or declined.
- Training and credential status: share of coordination staff with current training.
If workforce training is part of your plan, our guide to CHW certification requirements explains what program leaders need to know.
How to set up KPI tracking in practice
Step 1: Pick five to seven KPIs
Start with screening rate, referral rate, acceptance rate, completion rate, time to close, and need resolution. Add loss to follow-up once you can see unknown statuses. More than seven, and the monthly review turns into a data tour.
Step 2: Write the definitions down
For each KPI, record the numerator, denominator, time window, data source, and owner. Agree on whether a client with two referrals counts once or twice. Settle it now, because changing definitions later breaks trend lines.
Step 3: Standardize the data fields
Free-text notes cannot be counted. Use structured fields for need category, referral status, outcome, and reason codes. The CDC-published research describes organizations that standardize documentation with structured fields such as ICD-10 Z-codes so that completion of a referral and resolution of a need can be reported accurately.
Step 4: Get partners to confirm status
The loop closes only when the receiving organization says so. Agree on a simple status set with each partner: received, accepted, in progress, completed, declined. Care coordination agreements with consultants are a recognized practice. The CMS Quality Payment Program lists an improvement activity for care coordination agreements and active referral management that includes integrating referral information into the plan of care.
Our referral workflow guide for rural teams walks through this for Measure 374, and the referral tracking metrics article covers the first 90 days.
Step 5: Review monthly, act on exceptions
A dashboard is only useful if someone acts on it. Hold a 30-minute monthly review. Look at completion by partner, the oldest open referrals, and the top reason codes for loss. Assign one fix per meeting.
Step 6: Report to funders in their terms
Map each KPI to the language in your grant or contract. A funder who asks for “clients connected to services” wants your completion rate. A funder who asks for “outcomes” wants resolution. Keep a standing report template so quarterly reporting is a refresh, not a rebuild. See the care coordination dashboard guide for what a program director’s view should include.
Manual tracking versus a closed-loop platform
Spreadsheets can work for a single site with a few partners. They break when volume rises or when more than one person edits the file. The problems are predictable: duplicate rows, no audit trail, statuses that depend on someone remembering to call, and reports built by hand before every deadline.
Experts cited in CMS quality program materials advise that effective referral management requires active tracking rather than simply documenting a referral, and that success often comes from automating that work rather than relying on manual record-keeping.
When you evaluate software, look for these capabilities:
- Screening and intake that write to structured fields.
- Referral routing to both clinical and community partners.
- Status updates from the receiving partner, with automatic flags on overdue referrals.
- Dashboards that show completion, time to close, and resolution by partner and need.
- Exportable reports aligned to grant requirements.
- Compatibility with your existing systems of record, so staff do not enter data twice.
Our overview of care coordination software options compares these capabilities by type of platform.
Where EquiLoop fits
EquiLoop is WellCheck’s closed-loop referral and care coordination platform. It manages SDoH screening and intake, referral routing to clinical and community partners, follow-up and status tracking, outcomes dashboards, and funder-ready reporting. Each deployment is configured around the partner network, referral pathways, and reporting requirements your organization already has, and it is built to work alongside your existing systems rather than replace them.
EquiLoop is not a resource directory. Its job is workflow and accountability: recording what happened after the referral was made, so the KPIs in this article come from the work itself instead of a separate reporting exercise. You can read how it works on the closed-loop workflow page or see the EquiLoop product page.
If you want to see your KPIs mapped to a live workflow, book a 30-minute demo.
Common mistakes to avoid
- Counting sent referrals as success. Sent is the start of the loop.
- Averaging everything. An average hides the clients who waited weeks. Report the median and the slowest decile.
- Ignoring declined and unreachable clients. Reason codes are where program improvements come from.
- Changing definitions mid-year. Trend lines depend on stable definitions.
- Treating the KPI list as a reporting task only. If no one owns each number, no one will move it.
- Skipping partner onboarding. A partner who does not know how to confirm status will leave the loop open.
For a longer treatment of the underlying process, see our closed loop referral implementation guide.
FAQ
What are the most important KPIs for care coordination?
Start with referral completion rate, time to close, and need resolution rate. Add screening rate, referral rate, and acceptance rate to see where clients drop out of the process. Together they show both reach and follow-through.
How many KPIs should a community health program track?
Five to seven is a workable number for most programs. Each one needs a written definition, a data source, and an owner. Add more only after the first set is reviewed every month without strain.
How do you measure a closed referral loop?
Count a referral as closed when the receiving organization confirms the service was delivered or documents another final status, such as declined or ineligible. For clinical specialist referrals, CMS Quality ID #374 uses receipt of the specialist’s report as the signal. For community referrals, a partner status update does the same job.
What is a good referral engagement rate?
There is no single benchmark. A CDC-published pilot of health care referrals to community programs reported 29% engagement. Set your own baseline by referral type, then track change over time as you reduce barriers such as cost and transportation.
Can we track these KPIs without new software?
Yes, for a small program with few partners, using structured fields in a shared system. As partners and volume grow, manual status chasing becomes the bottleneck, and a workflow platform is the better fit.
Sources
- Quality ID #374: Closing the Referral Loop, Receipt of Specialist Report (CMS)
- Evaluation of an Electronic Health Record Referral Process (CDC, Preventing Chronic Disease)
- Social Risk Factor Screening and Referrals in Cancer Survivorship (CDC, Preventing Chronic Disease)
- Quality Measures in the Transforming Episode Accountability Model (CMS)
- Care Coordination Measures Atlas project (AHRQ)
- Care Coordination Measurement Framework (AHRQ)
- Follow-up Referral Tracking fact sheet (AHRQ)
- Health Resources and Services Administration, Bureau of Primary Health Care
- Explore Measures and Activities (CMS Quality Payment Program)
